Uploaded
Submitted by: nickcinquino Project Website: n/a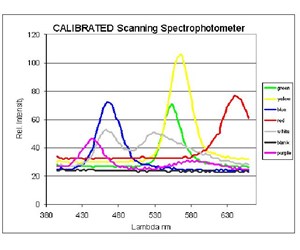
Uploaded
Submitted by: nickcinquino Project Website: n/a
PICAXE 08M2 SCANNING SPECTROPHOTOMETER
Nick Cinquino 10/6/2013
A scanning spectrophotometer scans through, and detects, a wide range of visible light wavelengths.
Compare that to a colorimeter, which checks one small range of wavelengths.
A scanning spectrophotometer can be used for the analyses of LED’s, sunglass lenses, and assorted chemistry analytical projects among many other setups.
Over the years I have made several spectrometers. Linear CCD arrays, rotating the grating, ad nauseum… none are as easy to make or use as this Picaxe 08M2 version!
The setup: An LED or other source is pointed at a slit, of 1.5mm width (it would be better skinnier but then sensitivity becomes more difficult) and 15mm high. On the back side of the slit is a piece of plastic diffraction grating. Make sure to attach the grating parallel with the slit. These gratings are cheap, about $4 on ebay, mounted in a slide.
With a transmission grating, some of the light passes straight through with no diffraction.
This will be used as a tool for alignment! Another slit, of 1.5mm width, 15mm height, is 3.75” downrange, with a CdS cell glued down to it.
To the left and right sides, at about 15 degrees, is the spectrum.
Another slit (identical, 1.5mm wide 15mm high) with CdS cell is on a movable “sled”, confined by “rails”, with another CdS cell.
The CdS cells are large, 11mm diameter, from Electronic Goldmine, in an assortment or grab bag.
A bent piece of paper clip, of 26mm length, connects the sled with slit/detector to a servo motor arm.
The servo motor, controlled by the Picaxe, slowly drags the slit across the projected spectrum.
The servo is a Mystery 9G from DX.com, $5.
All of this hardware is made from and mounted on scraps of FR4 fiberglass.
Since we’re detecting very low levels of light, both in the alignment of the light source and the intensity at the spectrum, the divider resistance is so high that the Picaxe ADC input will not accept it.
Therefore, both CdS circuits output to an LM324 single-supply quad opamp, set up as buffers or voltage followers.
This fixes the impedance headache.
The only drawback is that now the upper range is limited to 4V (debug of 200).
The alignment LED also helps you determine whether the source intensity is high enough for a good spectral amplitude.
The Picaxe program is set up to start the servo at an origin position, and slowly move the servo one step at a time.
After the sled/detector gets moved one step, there’s a 750msec pause for the CdS reading to settle, then the Picaxe reads the ADC value, and sends it out the serial line and into your computer, to the Picaxe Terminal.
When the scan is completed, the sled rewinds to it’s origin position.
At that point, you copy the terminal data, and paste into Excel.
Make a chart with the data, and there’s your spectral analysis! Here’s the Picaxe program, short and simple: ;PICAXE 08M2 Scanning Spectrophotometer Nick Cinquino 9/30/13 main: servo 1, 100 ; Set the servo to its starting position if pin3 = 1 then goto scan ; start scan run pause 300 goto main scan: high 2 ; LED on wait 2 ; wait 1 sec for b0 = 100 to 200 step 1 ; scan forward slow readadc 4,b1 ; read volts pin 4 serout 0, n2400, (",", #b1) ; serial data to terminal 2400 baud pause 750 servopos 1, b0 next b0 wait 2 ; pause on completion for b0 = 200 to 100 step -1 ; rewind servopos 1, b0 pause 100 next b0 pause 400 low 2 ; LED off goto main It would be best to mount the spectrometer inside a very dark enclosure, and I will eventually do that, but for now it works fine with all room lights off, in a very dark room.
In use, point the LED or incandescent lamp or other source at the first slit, typically 6” to 12” away from the slit.
Observe the “alignment” LED indicator, moving the source around until the alignment LED is glowing brightest.
The source is now aligned with the detector, and at a usable intensity.
Push the start button, and the run indicator LED lights up, and after a couple seconds, the scan begins very slowly.
The entire scan takes 1.25 minutes.
Upon completion, the sled returns quickly to the start position, and the data is in the Terminal.
It is ready for another run.
Eventually you’ll want to calibrate the instrument, so that the excel chart shows both relative intensity and wavelength in nanometers.
To do that, get some water-clear red, green and blue LED’s, of known output wavelength.
I used both individual LED’s and RGB LED’s.
The RGB LED’s say that red is at 625-628nm, green at 519-521nm and blue at 465-472nm.
These are available on ebay for a couple of dollars.
From the chart of intensity versus sample number, find the sample number for the 3 colors/known wavelengths.
In my setup, red was at sample 69, green at 41 and blue at 22.
Make a chart of sample vs. wavelength.
Extend it so it covers sample 1 through 100.
Add trendline, and display equation on chart.
Using the equation, make a new row of data that translates sample number into nanometers.
Replot, with wavelength on the X axis and relative intensity on the y axis.
In summary, the Picaxe is controlling a servo which drags a detector past the spectrum, and simultaneously collects data of intensity at each section of the spectrum.
Results are great; in example, a scan of a white LED shows clearly the blue LED component, plus the broad fluorescent component! Scanning Spectrophotometer specifications, as built: Servo pushrod: 26mm Servo arm position: 3rd hole from the tip.
Total transit distance: 20mm Slit width: 1.5mm x 15mm high Spectrum spread: 400-718nm Coverage: 318nm in 20mm Slit wavelength resolution: 16nm (318nm/20mm) Servo motion: 100 steps covers 20mm Servo step resolution: 3.18nm (318nm/100 steps) Entrance slit/grating to alignment slit distance: 3.75” Sampling distance: 6” – 12”

Share