PICAXE 14M2 LCD Barometer With Trend Analysis
Nick Cinquino 12/12/2013
A barometer measures atmospheric pressure, which can be a good indicator of future meteorological conditions. Just as a general guideline (ignoring wind direction changes for example), rapidly falling pressure tends to suggest that the weather might turn stormy, whereas rapidly rising pressure suggests clear weather ahead.
One problem with an old-fashioned mechanical dial barometer is that the observer has to go right up to it, read the pressure, and remember how much time has passed since the last reading, and did it rise or fall, and by how much. The only shortcut is if the unit has a movable pointer, that the observer hopefully remembered to set to the previous reading!
A Picaxe is ideally suited to handle these tasks, so that the observer only needs to take a quick glance to see if pressure is in a rising, falling or stable trend. If the observer wants more detail, the Picaxe is displaying the pressure, in inches of mercury, to the nearest 0.1 inch, on a 16 x 2 LCD display.
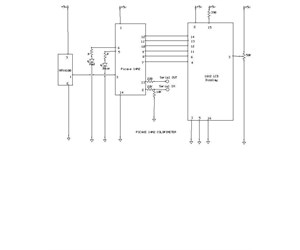
Circuit detail: An MPX4100AP pressure sensor, from Freescale (typically found on ebay for around $20) is constantly measuring the atmospheric pressure, and outputting an analog voltage to a Picaxe 14M2. The Picaxe A to D converts the voltage into a debug value. Every 4 seconds, the Picaxe displays the debug voltage, converted to inches of mercury (this could be converted into most other pressure units) on the 16 X 2 LCD display. Additionally, running in parallel, every 4 hours, the Picaxe compares the previous value to the present value, and if the new value is higher, by 0.1 or more inches of mercury, it switches on a blue LED (because the pressure trend is rising). If the new value is lower than the old value, by 0.1 or more than the old value, a red LED is switched on, indicating a downward trend in pressure. If pressure stays the same over the 4 hour period, both LED’s switch off, indicating stable pressure.
The LCD display of pressure has a resolution of 0.1 inch of mercury. This made everything much easier, and I think still gives good, meaningful results. The reason is, to go up by one debug value, the input voltage needs to rise by 0.0196 V. As it happens, the output of the pressure sensor happens to, by sheer luck, increase by very close to that same value, about 0.019V, for each 0.1 inch of mercury.
So, a debug value change of 1 = a pressure change of 0.1 inches of mercury!
Many thanks to P. Beard for publishing the code that allows a 14M2 to run a 16x2 LCD display! The code is lengthy…I’m sure it can be written much more efficiently, but I have no idea how!
Following is the software downloaded into the 14M2:
'NJC Barometer 11/15/2013
#picaxe 14m2
start0:
symbol LCD_D4 = pinB.4
symbol LCD_D5 = pinB.3
symbol LCD_D6 = pinB.2
symbol LCD_D7 = pinB.1
symbol LCD_E = B.5
symbol LCD_RS = C.0
output c.1
output c.2
input c.4
readadc c.4, b9
debug b9
if b9 <= 207 then prslow:
if b9 = 208 then prs279:
if b9 = 209 then prs280:
if b9 = 210 then prs281:
if b9 = 211 then prs282:
if b9 = 212 then prs283:
if b9 = 213 then prs284:
if b9 = 214 then prs285:
if b9 = 215 then prs286:
if b9 = 216 then prs287:
if b9 = 217 then prs288:
if b9 = 218 then prs289:
if b9 = 219 then prs290:
if b9 = 220 then prs291:
if b9 = 221 then prs292:
if b9 = 222 then prs293:
if b9 = 223 then prs294:
if b9 = 224 then prs295:
if b9 = 225 then prs296:
if b9 = 226 then prs297:
if b9 = 227 then prs298:
if b9 = 228 then prs299:
if b9 = 229 then prs300:
if b9 = 230 then prs301:
if b9 = 231 then prs302:
if b9 = 232 then prs303:
if b9 = 233 then prs304:
if b9 = 234 then prs305:
if b9 = 235 then prs306:
if b9 = 236 then prs307:
if b9 = 237 then prs308:
if b9 = 238 then prs309:
if b9 = 239 then prs310:
if b9 = 240 then prs311:
if b9 = 241 then prs312:
if b9 = 242 then prs313:
if b9 = 243 then prs314:
if b9 = 244 then prs315:
if b9 = 245 then prs316:
if b9 = 246 then prs317:
if b9 = 247 then prs318:
if b9 = 248 then prs319:
if b9 = 249 then prs320:
if b9 = 250 then prs321:
if b9 >= 251 then prshigh:
prslow:
b8 = 76 ;print lo
b7 = 79
b6 = 32
b5 = 32
goto display
prs279:
b8 = 50 ;print 27.9
b7 = 55
b6 = 46
b5 = 57
goto display
prs280:
b8 = 50 ;print 28.0
b7 = 56
b6 = 46
b5 = 48
goto display
prs281:
b8 = 50 ;print 28.1
b7 = 56
b6 = 46
b5 = 49
goto display
prs282:
b8 = 50 ;print 28.2
b7 = 56
b6 = 46
b5 = 50
goto display
prs283:
b8 = 50 ;print 28.3
b7 = 56
b6 = 46
b5 = 51
goto display
prs284:
b8 = 50 ;print 28.4
b7 = 56
b6 = 46
b5 = 52
goto display
prs285:
b8 = 50 ;print 28.5
b7 = 56
b6 = 46
b5 = 53
goto display
prs286:
b8 = 50 ;print 28.6
b7 = 56
b6 = 46
b5 = 54
goto display
prs287:
b8 = 50 ;print 28.7
b7 = 56
b6 = 46
b5 = 55
goto display
prs288:
b8 = 50 ;print 28.8
b7 = 56
b6 = 46
b5 = 56
goto display
prs289:
b8 = 50 ;print 28.9
b7 = 56
b6 = 46
b5 = 57
goto display
prs290:
b8 = 50 ;print 29.0
b7 = 57
b6 = 46
b5 = 48
goto display
prs291:
b8 = 50 ;print 29.1
b7 = 57
b6 = 46
b5 = 49
goto display
prs292:
b8 = 50 ;print 29.2
b7 = 57
b6 = 46
b5 = 50
goto display
prs293:
b8 = 50 ;print 29.3
b7 = 57
b6 = 46
b5 = 51
goto display
prs294:
b8 = 50 ;print 29.4
b7 = 57
b6 = 46
b5 = 52
goto display
prs295:
b8 = 50 ;print 29.5
b7 = 57
b6 = 46
b5 = 53
goto display
prs296:
b8 = 50 ;print 29.6
b7 = 57
b6 = 46
b5 = 54
goto display
prs297:
b8 = 50 ;print 29.7
b7 = 57
b6 = 46
b5 = 55
goto display
prs298:
b8 = 50 ;print 29.8
b7 = 57
b6 = 46
b5 = 56
goto display
prs299:
b8 = 50 ;print 29.9
b7 = 57
b6 = 46
b5 = 57
goto display
prs300:
b8 = 51 ;print 30.0
b7 = 48
b6 = 46
b5 = 48
goto display
prs301:
b8 = 51 ;print 30.1
b7 = 48
b6 = 46
b5 = 49
goto display
prs302:
b8 = 51 ;print 30.2
b7 = 48
b6 = 46
b5 = 50
goto display
prs303:
b8 = 51 ;print 30.3
b7 = 48
b6 = 46
b5 = 51
goto display
prs304:
b8 = 51 ;print 30.4
b7 = 48
b6 = 46
b5 = 52
goto display
prs305:
b8 = 51 ;print 30.5
b7 = 48
b6 = 46
b5 = 53
goto display
prs306:
b8 = 51 ;print 30.6
b7 = 48
b6 = 46
b5 = 54
goto display
prs307:
b8 = 51 ;print 30.7
b7 = 48
b6 = 46
b5 = 55
goto display
prs308:
b8 = 51 ;print 30.8
b7 = 48
b6 = 46
b5 = 56
goto display
prs309:
b8 = 51 ;print 30.9
b7 = 48
b6 = 46
b5 = 57
goto display
prs310:
b8 = 51 ;print 31.0
b7 = 49
b6 = 46
b5 = 48
goto display
prs311:
b8 = 51 ;print 31.1
b7 = 49
b6 = 46
b5 = 49
goto display
prs312:
b8 = 51 ;print 31.2
b7 = 49
b6 = 46
b5 = 50
goto display
prs313:
b8 = 51 ;print 31.3
b7 = 49
b6 = 46
b5 = 51
goto display
prs314:
b8 = 51 ;print 31.4
b7 = 49
b6 = 46
b5 = 52
goto display
prs315:
b8 = 51 ;print 31.5
b7 = 49
b6 = 46
b5 = 53
goto display
prs316:
b8 = 51 ;print 31.6
b7 = 49
b6 = 46
b5 = 54
goto display
prs317:
b8 = 51 ;print 31.7
b7 = 49
b6 = 46
b5 = 55
goto display
prs318:
b8 = 51 ;print 31.8
b7 = 49
b6 = 46
b5 = 56
goto display
prs319:
b8 = 51 ;print 31.9
b7 = 49
b6 = 46
b5 = 57
goto display
prs320:
b8 = 51 ;print 32.0
b7 = 50
b6 = 46
b5 = 48
goto display
prs321:
b8 = 51 ;print 32.1
b7 = 50
b6 = 46
b5 = 49
goto display
prshigh:
b8 = 72 ;print hi
b7 = 73
b6 = 32
b5 = 32
goto display
display:
'Initialise LCD
dirB.1 = 1 : dirB.2 = 1 : dirB.3 = 1 : dirB.4 = 1
low LCD_RS
for b1 = 0 to 4
lookup b1, ($33,$32,$28,$0C,$01), b0 '(4Bit)(Function 4bit/2line/5x8)(Display On)(Clear Display)
gosub LCD_send
next
high LCD_RS
for b1 = 0 to 16
lookup b1, ("Barometric Pres:"), b0
gosub LCD_send
next
low LCD_RS : b0 = $C0 : gosub LCD_send
high LCD_RS
for b1 = 0 to 11
lookup b1, (" inHg: ", b8,b7,b6,b5), b0
gosub LCD_send
next
wait 4
goto start0
LCD_send: 'Send B0 to LCD
LCD_D4 = bit4 : LCD_D5 = bit5 : LCD_D6 = bit6 : LCD_D7 = bit7 : pulsout LCD_E, 1
LCD_D4 = bit0 : LCD_D5 = bit1 : LCD_D6 = bit2 : LCD_D7 = bit3 : pulsout LCD_E, 1
return
goto start0
start1:
b11=b10
for b13 = 1 to 4
for b12 = 1 to 60
wait 60
next b12
next b13
input c.4
readadc c.4, b10
debug b10
if b10 > b11 then goto ind1 ;rising
if b11 > b10 then goto ind2 ;dropping
if b10 = b11 then goto ind3 ;stable
goto start1
ind1:
low c.1
high c.2 ;blue
wait 1
goto start1
ind2:
low c.2
high c.1 ;red
wait 1
goto start1
ind3:
low c.1, c.2
wait 1
goto start1
I’ve been monitoring this circuit for 3 weeks and it’s doing very well; LCD reading accuracy is good, and the 4-hour trend analysis is right on. Here in Illinois on November 17, we had some very nasty weather, with tornadoes. The pressure took a very sharp dip, followed by rise. This circuit caught the rare event well. Check out the video to see a chart, and meteorological surface analysis from that stormy day.
Future work: I intend to add an additional Picaxe, an 08M2, set up as a datalogger, to collect 200 pressure (voltage) readings, at one reading every hour, from the same MPX4100AP sensor. For 200 readings at one reading per hour, this means the Picaxe can hold a full week of readings! Then the logged readings can be downloaded into Excel and graphed.
Some minor software changes can correct for the slight inaccuracy that might be seen at the far ends of the scale, such as above 31 or below 29.
The datasheet for the MPX4100AP sensor can be found here:
https://www.freescale.com/files/sensors/doc/data_sheet/MPX4100A.pdf
Print Page

Share